Many security bugs are race conditions, where multi-threaded execution has to occur with the right interleaving for a negative effect to appear. This creates challenges for several use cases:
- Confirming bug candidates that have been discovered manually or through static analysis.
- Regression tests: After fixing a race condition bug, there is often no good way to write a regression test that reliably triggers the bug as part of a test suite.
- Automatic bug discovery, such as fuzzing: It is hard for a fuzzer to exercise all interesting interleavings of concurrent operations, or reach code paths that are only exercised when operations are racing.
I mostly discover bugs by manually reading code. When I think I’ve found a bug, I normally write a test case to either prove or disprove that the bug exists. For race condition bugs, it can be hard to achieve either outcome. For Linux kernel bugs, I often resort to recompiling the kernel after adding conditional mdelay() calls (which spinloop for roughly the specified amount of time) in appropriate places; I usually make these conditional based on the name of the running thread, though sometimes more complex conditions are needed. On platforms that support DTrace (like macOS and Windows), it is possible to use DTrace probes that call chill() for similar effect, though the utility of this is limited as DTrace can only trace on non-inline function boundaries or explicit trace points, rather than on every instruction. Regardless of platform, this approach can be time consuming and can require trial and error to definitely determine whether code is buggy.
Additionally, in the Linux kernel, fixes for race condition bugs are often accompanied by hand-written ASCII diagrams showing problematic thread interleavings with call graphs and relevant memory accesses (for example, see this recent rt_spin_unlock UAF fix, or this recent jbd2 deadlock fix). It would be convenient to have developer tooling that can analyze potentially vulnerable code and show results in a similar representation.
Summary
I wrote tools for exploring possible interleavings of multi-threaded test cases for the Linux kernel:
- A tool that automatically tests all possible A-B-A interleavings of a test case.
- A terminal UI for manual exploration of possible interleavings.
- A GUI for manual exploration of possible interleavings.
The kernel part of this is intended to also be usable for discovering race conditions via fuzzing, but userspace tooling for that still needs to be implemented.
The tools are available on GitHub under the name MAccConc, short for “Memory Access Concurrency”; see the README there for installation and usage instructions.
If you just want to see the tooling in action, skip to Demo: automatic testing.
If you’re just interested in the theory behind the tooling, read section Stable identifiers for memory accesses across runs: count-augmented stack traces.
Prior work
This project was inspired by discussions with Ned Williamson, whose sockfuzzer project involved exploration of concurrency bugs by using a custom scheduler that can reschedule at synchronization primitives to explore interleavings. See the conference talk slides and recording focused on the concurrency testing aspect of this.
My tooling is largely based on ideas similar to SKI, but SKI uses a different implementation: It records memory accesses and controls scheduling of vCPUs using a patched version of QEMU in TCG mode, and uses VM snapshots to explore different execution interleavings.
Discovering memory accesses that could contribute to race conditions (communication points)
As described in the SKI paper, interesting execution interleavings of a given multi-threaded test case can be discovered by tracing memory accesses of all threads and searching for pairs of accesses on two threads that could interact with each other - meaning, roughly, that at least one of them is a write operation, and they access overlapping memory ranges. The SKI paper calls such memory accesses communication points.
This requires some mechanism to collect memory access coverage. SKI did this by patching QEMU’s TCG mode; I am instead relying on ASAN instrumentation in “outline” mode (compiler backend flag asan-instrumentation-with-call-threshold=0, selected by CONFIG_KASAN_OUTLINE in the Linux kernel), which generates helper function calls on memory access. I believe that the kernel is the right place to collect this data because it would allow the kernel to also provide higher-level information about lock acquire/release events and such, though I have not implemented this at this time. Implementing this in the kernel also means that it would theoretically be possible to test on bare-metal hardware, rather than inside VMs.
Since Linux already has KCOV as a mechanism to feed basic block kernel coverage information to userspace, I decided to use the same mechanism to record information about memory accesses. An alternative would have been to use ftrace, which is oriented towards tracing use cases, and includes a function graph tracing mode built on fentry hooks and more complex output buffer management that is oriented towards use cases including system-wide data collection. I chose to use KCOV because of its simpler in-memory representation of trace data (which could become relevant for recovering trace data from crashed VMs); because it uses static always-on instrumentation rather than runtime-enabled instrumentation with near-zero overhead in disabled state; and because my impression is that KCOV is designed for higher-frequency trace events than ftrace.
Implementation detail: ASAN and TSAN
ASAN normally merges helper calls for subsequent memory accesses. To receive one callback per memory access, the kernel patches explicitly disable this compiler optimization using the asan-opt-same-temp backend flag.
ASAN is intended for identifying UAF, so it does not emit helper calls on direct stack memory access unless there is potential for out-of-bounds access. This means that some race conditions involving on-stack objects, such as wait queues, may not be detectable with this. ASAN also by default emits no helper calls for access to globals, but this optimization can be disabled using the asan-opt-globals backend flag.
An alternative would be to use TSAN instrumentation instead, which is designed for detecting data races and also provides information about access atomicity. The downside of TSAN instrumentation is that compilers do not support emitting both ASAN and TSAN hooks at the same time - so to still have working detection of memory safety violations (like UAF) while using TSAN hooks, it would be necessary to run the kernel’s ASAN implementation off of the TSAN hooks or change the compiler.
Implementation detail: KCOV and background work
Some race conditions involve background work, for example:
- receive processing of loopback network packets
- RCU callbacks
KCOV can optionally collect remote coverage for background work in some subsystems; however, in upstream Linux, most types of background work that would be interesting for me are not yet integrated with this mechanism, and remote coverage is currently mainly used for fuzzing subsystems that handle incoming data from devices, like bluetooth and USB.
Enabling this for other parts of the kernel should be relatively straightforward, and I have a draft patch for doing this for RCU callbacks.
Stable identifiers for memory accesses across runs: count-augmented stack traces
To test out different orderings of memory accesses, a way to stably identify interesting memory accesses across test case executions is needed. Identifying memory accesses based on the data address would not work if the data address was located in an object which is freshly allocated during each test case execution; and identifying memory accesses solely by instruction address would not work well if the memory access was in a function like memcpy() or spin_lock().
SKI solves this using VM state snapshots, so that each execution starts from the same global state.
I am instead identifying memory accesses with count-augmented stack traces, where each stack trace element essentially consists of a callee function address and a number indicating how many calls to this callee should be skipped in the calling stack frame.
An example of the semantics of a count-augmented stack trace would be something like: “On this thread, look at the second call to __x64_sys_recvfrom, then within that, the first call to __sys_recvfrom, then within that the first call to sock_recvmsg, then within that, the first call to unix_stream_recvmsg, then within that, the first call to unix_stream_read_generic, then within that, the second call to _raw_spin_unlock, and then within that, the first memory access at instruction address X”.
This unambiguously identifies a point in an execution trace, is independent of concrete data addresses, and is relatively stable with regards to changes in the control flow of irrelevant parts of the trace.
To make this work, KCOV must provide information about function entry/exit events so that when userspace is parsing KCOV coverage output, it can keep track of how the call stack changes. Doing this nicely requires compiler support as part of SanitizerCoverage; I landed an LLVM feature patch for this a few months ago (see documentation), which landed in the LLVM 23.1.0 release.
Forcing execution orderings with delay injection
To force specific execution orderings through KCOV, I implemented an ioctl KCOV_SET_DI using which userspace can request that actions (essentially wait/wake) are taken on memory accesses at specific count-augmented stack traces. (See documentation in my kernel branch.) Each action either sets one flag, or waits for one flag to be set, at a userspace-provided index in a shared array of flags. The possible action types are:
DI_STACK_WAKE_PRE: before the memory access, set flag NDI_STACK_WAIT: before the memory access, spin-wait until flag N is setDI_STACK_WAKE_POST: after the memory access, set flag N
With the same ioctl, userspace also configures an upper limit on spin-wait iterations.
Additionally, there are ioctls for userspace to directly interact with the same flags.
This API enables two different ways of using delay injection: constraint-style delay injection and fully-specified ordering.
Constraint-style delay injection (A-happens-before-B)
Userspace can set up a series of A-happens-before-B constraints, where each such constraint is implemented as a pair of actions in different threads that operate on the same flag:
DI_STACK_WAKE_POSTfor the access that should happen firstDI_STACK_WAITfor the access that should happen second
With this approach, the execution ordering is left partly non-deterministic. This is what the GUI and terminal UI tools currently implement.
An advantage is that this is somewhat more intuitive for simple cases; however, it requires recording timing information to show the user approximately in what order events happened, and it can make the execution trace more complicated. It also often requires more constraints than a fully specified ordering, and is more complicated to reason about.
Fully specified ordering (context-switch-style)
Userspace can decide on a specific ordering in which events should occur, by picking points at which execution should transfer from one context to another. For the simple case with two execution contexts, this requires that thread A starts running a syscall while thread B begins by spin-waiting on a flag; then when thread A reaches some count-augmented stack trace, thread A uses a combination of DI_STACK_WAKE_PRE and DI_STACK_WAIT to pause its own execution and let thread B continue; and later, thread B can do the same to switch back.
This is the approach I used for the automatic A-B-A interleaving tester.
Demo: automatic testing
I’ll explain more background below; but first, here are two shiny demos on a toy example!
This is an example of using the automatic A-B-A interleaving tester on this test case with concurrent dup(5) and close(5) calls:
#define _GNU_SOURCE
#include <errno.h>
#include <fcntl.h>
#include <stdio.h>
#include <stdlib.h>
#include <string.h>
#include <unistd.h>

static int test_fd;
static int dup_res, dup_errno;

void test_setup(void) {
  test_fd = open("/", O_PATH);
}

void test_thread1(void) {
  dup_res = dup(test_fd);
  dup_errno = errno;
}

void test_thread2(void) {
  close(test_fd);
}

void test_end(void) {
  printf("dup(%d) = %d (%s)\n",
      test_fd,
      dup_res,
      dup_res == -1 ? strerror(dup_errno) : "success");
}
It discovers one ordering where dup(5) returns 5, which is working as intended but might be a somewhat surprising result:
sh-5.3# ./kcov-autorace testcase/demo-dup-vs-close.so
loading kallsyms
RCU state (excluded): base=ffffffff82970100 len=500
loading testcase
initializing kcov
collecting A-B coverage
dup(5) = 6 (success)
testing candidates
dup(5) = -1 (Bad file descriptor)
dup(5) = -1 (Bad file descriptor)
dup(5) = -1 (Bad file descriptor)
dup(5) = 5 (success)
dup(5) = 6 (success)
dup(5) = 6 (success)
dup(5) = 6 (success)
dup(5) = 6 (success)
dup(5) = 6 (success)
dup(5) = 6 (success)
dup(5) = 6 (success)
stats:  injection-failed:0  wait-timeout:7  reordered:4
sh-5.3#
Demo: GUI
And here is an example of me using the GUI on the same test case, using it to manually force an ordering where dup(7) returns 7.
First, I launch the GUI, then run the test case once in the guest:
sh-5.3# ./kcov-vsock-client testcase/demo-dup-vs-close.so
dup(7) = 8 (success)
At this point, no ordering constraints are enforced yet; dup() and close() are racing randomly. The GUI shows in what order execution happened:
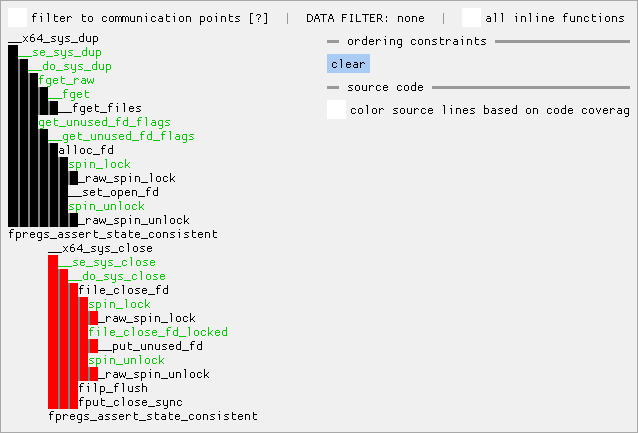
This current view just shows function call graphs from both threads (thread 1 with black indent, thread 2 with red indent). The close() syscall happened to execute after dup() this time. Normal functions are shown in black; inline functions are shown in green, but only shown if they called a normal function (since “all inline functions” is not ticked).
Ticking “filter to communication points” shows a bunch of memory accesses in blue, which are communication points (as defined above, in short: reads from locations to which other threads write and writes to locations which other threads access; kfree() counts as a write operation). Each memory access line shows the type of access (Read/Write/Free), data address, access size, and the memory value before the access. Hovering over an access highlights all overlapping accesses in yellow.
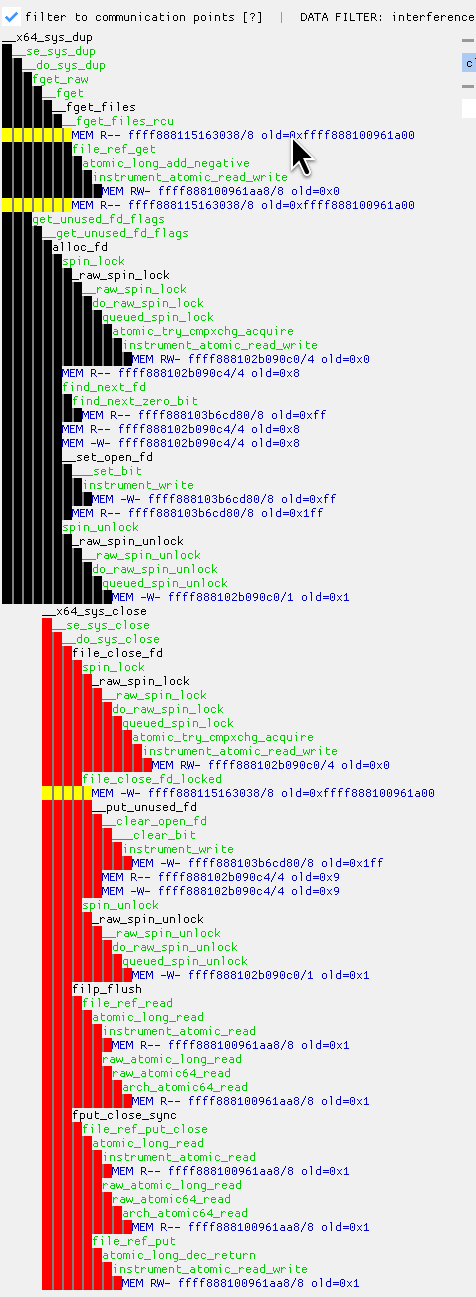
Left-clicking on a memory access shows a view that is instead filtered to only show memory accesses overlapping the selected access. Note that this can show reads that were not identified as communication points (because all writes happen on the same thread).
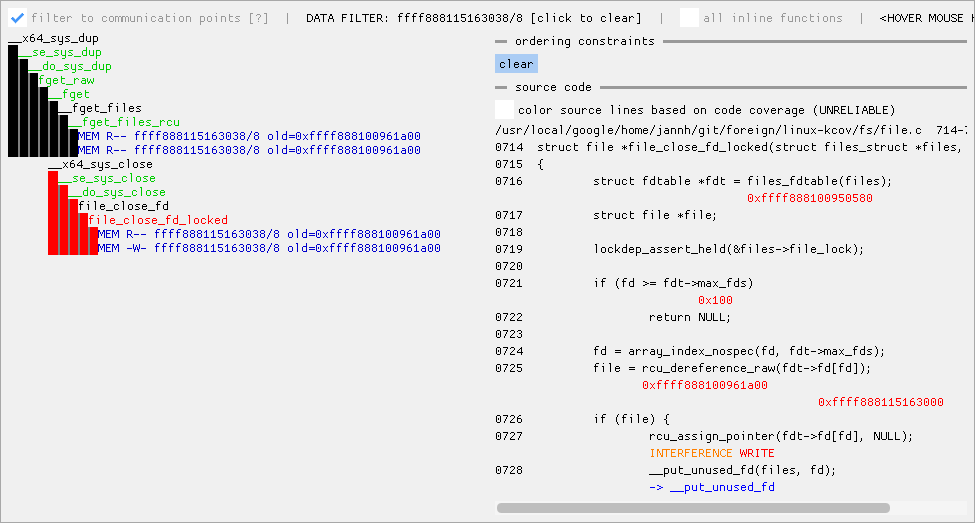
Left-clicking a function name shows a source code view on the right, interspersed with trace data. Data values loaded by memory reads are shown in red (under the source line and column to which the compiler attributes the access); data writes are marked similarly with a red “WRITE”; memory accesses that are communication points are prefixed with “INTERFERENCE” in orange. Function calls are shown in blue.
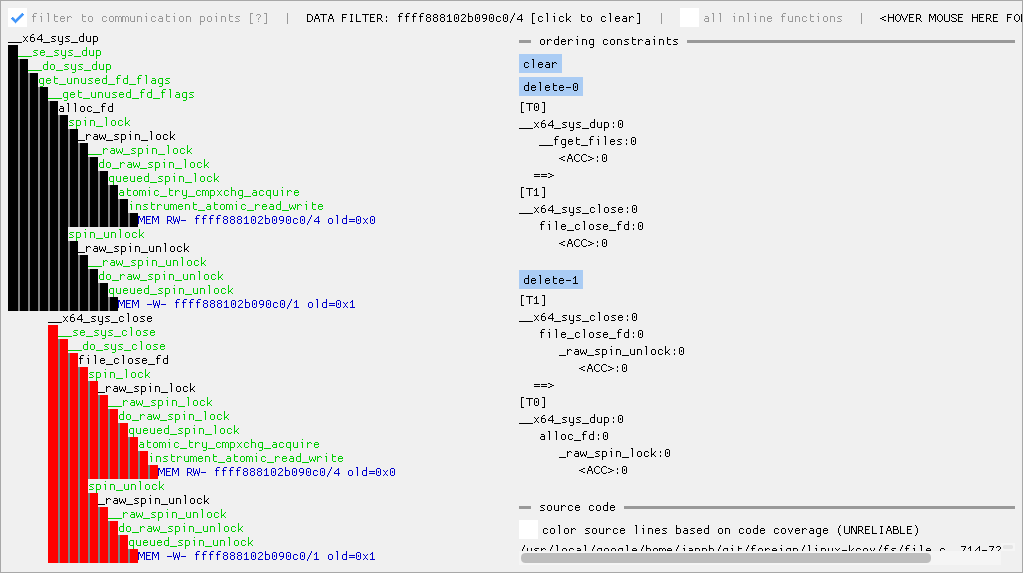
By right-clicking on two memory accesses in the call graph view, it is possible to create an ordering constraint between the two accesses, such that the kernel will attempt to make the first selected access happen before the second selected access. Each ordering constraint is shown on the right side, represented as two count-augmented stack traces. Note that the last bottom element of the stack actually identifies a specific instruction, but the UI doesn’t really show this. Also, the count-augmented stack traces shown here do not include inline functions.
In this case, I have created one ordering constraint that orders the second file descriptor table access in __fget_files_rcu() (which is inlined into __fget_files()) before the file descriptor table entry removal in file_close_fd_locked() (which is inlined into file_close_fd()). This ensures that the file descriptor table lookup in dup() successfully looks up the file descriptor table entry before it is cleared by the concurrent close().
I have created another ordering constraint that orders the spin_unlock(&files->file_lock) in file_close_fd() before the spin_lock(&files->file_lock) in alloc_fd() so that the file descriptor table entry has been released by the time dup() searches for an unused entry.
In this view, ordering constraints have been specified, but the test case has not yet been run with this specified ordering.
(This view is filtered to show accesses to the files_struct::file_lock.)
Now, re-running the test case shows:
sh-5.3# ./kcov-vsock-client testcase/demo-dup-vs-close.so
dup(7) = 7 (success)
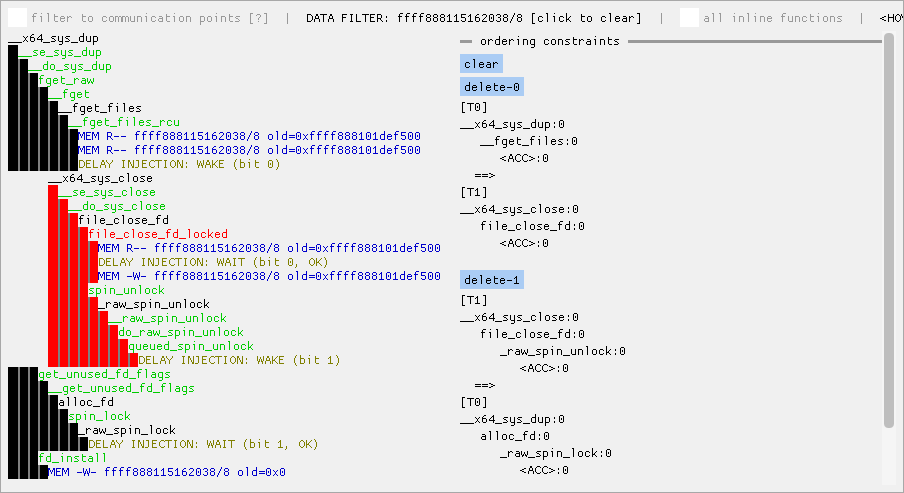
And the new trace appears in the UI, with brown “DELAY INJECTION” lines interspersed to show how the ordering constraints were applied.
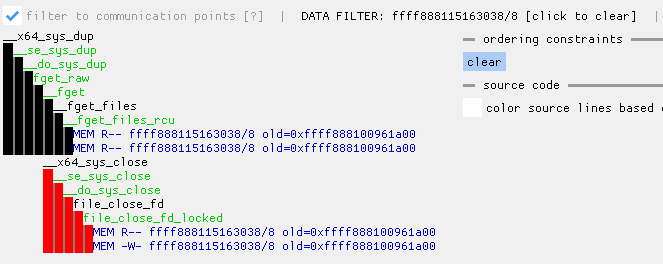
Note that the UI shows the ordering of events based on timing information that is associated only with memory accesses; the placement for any event other than a memory access is inferred based on that. In views filtered by data accesses, function entry events are additionally only shown at the time of the first displayed non-function-entry event. For example, in the following screenshot, the first thread may have already entered get_unused_fd_flags() by the time file_close_fd() called spin_unlock(), even though the events are shown the other way around. However, memory accesses should be shown in approximately the right order; with the caveats that the order of memory accesses might be wrong if events happened at the same clock value, and that timing information is recorded by instrumentation that runs directly before the actual access. (Building the tool on fully specified orderings instead would avoid such caveats.)
(This view is filtered to show accesses to the file descriptor table entry.)
More documentation is available inside the GUI.
Implementation status
For LLVM: The required patch has landed in LLVM 23.1.0.
For the Linux kernel: The required patches are not yet in the upstream kernel. I am posting the Linux kernel patch series for upstream review around the same time as this blog post; a git branch with my patches is also available on github (with a few more patches that aren’t yet ready for upstreaming). If you want to test this tooling, you will need to use my kernel branch for now. (See the README in the tools repository for build instructions.)
My kernel patches are in a clean state; the userspace tooling is a bit more hacky, in particular the GUI implementation.
The command-line tooling can only handle two concurrent threads, while the GUI can handle additional execution contexts (with the kcov-vsock-client harness: background work launched by thread A).
I am looking forward to hearing if this is useful to others, and maybe even what tools others manage to build on top of this! Feel free to reach out to me (for example via email to maccconc-tooling@google.com).
Future work
Use fully specified orderings instead of constraint-style for manual tooling
The non-automatic tooling currently uses constraint-style delay injection; but as described above, fully-specified orderings have several advantages, including more deterministic behavior. I might change the GUI implementation to use fully-specified orderings instead in the future.
Type information for human-readable memory access traces
For reading memory access traces as a human, it might be helpful to provide information on the object types that are being accessed. One way to do this would be to follow what Microsoft’s debugging tools can do with CodeView debuginfo and use debuginfo to associate memory allocation function call sites with type information, then let the allocator track the call sites from which objects have been allocated.
I proposed to add such a feature to the DWARF standard, which has been accepted and is included in the current DWARF 6 draft (search for DW_AT_alloc_type), and added enough support to LLVM to make it work in the same cases where it already worked with CodeView; but so far that only works for C++ new calls, I did not land the changes necessary to make it work for malloc.
Making this work in the kernel would require infrastructure that either queries allocator metadata for every memory access record or provides an initial snapshot of heap allocator metadata across the system plus metadata about subsequent memory allocations.
Higher-level memory access feedback
One inefficiency in my current prototype is that userspace receives no information about the semantics of locking operations. If two threads each perform lots of memory accesses on an object while holding a lock protecting the object, this will generate a large number of potential communication points, but actually a locked section just represents one big communication point. It might be helpful if the kernel provided “lock acquired” and “lock about to be released” events.
But that might not be a very general approach, since impossible orderings caused by locking are not so different from impossible orderings caused by things like an object being initialized before it is published to a global pointer or such.
Detecting impossible orderings faster: Deadlock detection
In my current implementation, when an attempt is made to force an impossible ordering via delay injection, the result is that one thread spins/waits on a lock until another thread reaches the delay injection timeout, which is inefficient. It might help to have integration with lock debugging infrastructure that can detect such a semi-deadlock in simple cases and abort the test case faster.
Fuzzing: Building up test cases with potential communication points like Snowboard
Snowboard (a project that searches for concurrency bugs caused by interaction between fuzzer-generated single-threaded test cases) used recorded information about memory accesses in single-threaded test cases to identify which test cases could have interesting communication points when executed in parallel. It would be interesting to build something similar on top of this KCOV-based instrumentation.
It might also be interesting to use this for single-threaded test case creation: Start by collecting memory access coverage for individual system calls, then use that to determine which syscalls might interact with each other in interesting ways when executed in sequence, and build up longer system call sequences this way.
This would be easier using VM snapshots (like SKI), since my approach does not lead to stable data addresses across test case executions; but it would probably be possible by identifying memory locations that are different between test cases abstractly based on allocation sites, as long as allocation site information is available for all objects that are allocated per test case execution.
KCOV output to host-shared memory
My current tooling loses KCOV output if the kernel under test panics, so it can’t be used for displaying what happened when a kernel crash occurred.
For use cases where the kernel under test is a KVM guest, it might be useful to give the host direct access to the KCOV output buffer. One way to do this might be to use pages in a file on virtiofs with DAX as the KCOV output buffer, and allow writing KCOV output into userspace-provided pages.